Plant Root RNA-seq Dashboard
Dashboard Report
Summary
Interactive app created on Arabidopsis Thaliana root RNA-seq with ShinyApp application.
0 - Table of Contents
1 - Introduction
Single-cell RNA sequencing (scRNA-seq) is a powerful technique that allows scientists to study gene activity in individual cells. Unlike traditional methods that average gene activity across many cells, scRNA-seq provides a detailed view of what is happening in each cell. This helps researchers identify different cell types, understand how cells function, and discover how diseases develop. By examining the unique gene expression in single cells, scRNA-seq has greatly advanced our ability to understand organisms.
The dataset used for this dashboard comes from the scientific article “A single cell Arabidopsis root atlas reveals developmental trajectories in wild type and cell identity mutants” by Shahan et al. (2022). This article examines the development of Arabidopsis Thaliana roots in both wild type and cell identity mutants using single-cell transcriptomics. By employing this high-resolution technique, the study analyzes gene expression to identify distinct cell types and track their gene expression throughout development. By comparing gene expression in wild type and mutant roots, researchers aim to identify the genes that influence root development and cell fate determination. The ultimate goal is to pinpoint key genes crucial for development and those that play a role in determining cell fate.
The client requested UMAP and PCA visualizations to quickly identify and compare similarities and differences among cell clusters. To achieve this, we needed to understand the biological significance of the data based on known and anticipated biomarkers, so we could effectively communicate our findings to the client. It was essential to identify which genes served as cell type markers, regardless of their statistical significance for differentiating clusters. These insights were visualized based on the expression values provided by the client. Additionally, we were asked to explore the data to see if the predicted marker genes overlapped with any previously known markers.
This dashboard is designed to analyze plant single-cell RNA-seq data, detailing its functionalities, and visualizing the provided dataset to help the client draw meaningful biological conclusions. The client conducted single-cell RNA-seq on cells from Arabidopsis Thaliana root to monitor its development through visual representations. These visualizations were developed using a ShinyApp application, which ensured that the images were cohesive and easy to understand, allowing the client to draw effective conclusions from their results. This is especially important because single-cell RNA-seq datasets are inherently large and complex, making it challenging to derive clear insights. Although the client provided pre-clustered data, our task was to identify similarities and differences between the clusters.
By carefully addressing our client’s requirements, we ensured that the dashboard would be a valuable tool for the client, providing clear visualizations and insights into the complex single-cell RNA-seq data of Arabidopsis Thaliana roots. This comprehensive approach allows the client to make informed decisions and draw significant conclusions from their research data.
2 - Product Description
To meet our client’s needs, we produced a ShinyApp. It was important that it be interactive so that the client could visually see the differences between different graphs (depending on their clusters, markers, PCA, etc.). This was done using the ggplot package for all of the plots and figures. The structure of the app itself consists of three tabs, created using the tabsetPanel method. Each of these tabs were then further divided into columns using the fluidRow method. The first tab consists of both a UMAP and PCA scatterplot, the second tab contains a heat map and bar chart, and the third tab holds two different subtabs that display the presence of putative and anticipated markers in each cluster. We decided to break up these tasks in order to optimize efficiency.
2.1 - UMAP and PCA with Clusters
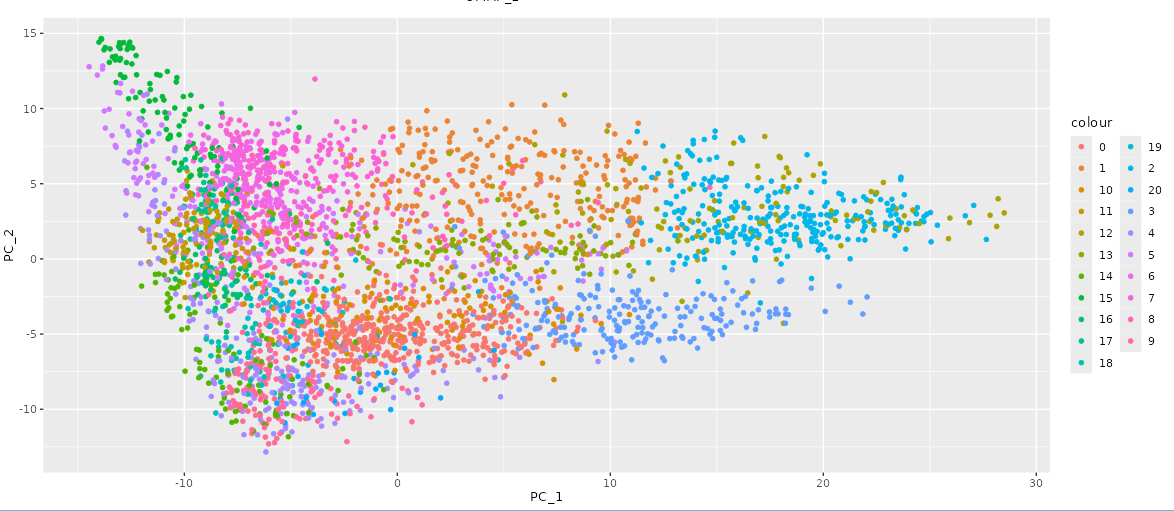
In the first tab of our interactive Shiny application, the client provided the UMAP coordinates and principal component values. To meet the client’s requirements for the PCA plot, we included two dropdown menus created with the selectInput method, enabling the client to choose which principal component values to display on the x-axis and y-axis. Once selected, the graph updates immediately without refreshing the page. For both the UMAP and PCA plots, each cluster was assigned a distinct color to clearly differentiate them, ensuring all points within a cluster share the same color (as shown in Figure 1). By default, all clusters are visible. The client can deselect and reselect clusters using a menu of checkboxes, located below the plots, created with the checkboxGroupInput function. This allows them to view a subset of clusters as desired. The PCA graph is shown below.
2.2 - Cluster Coorelation
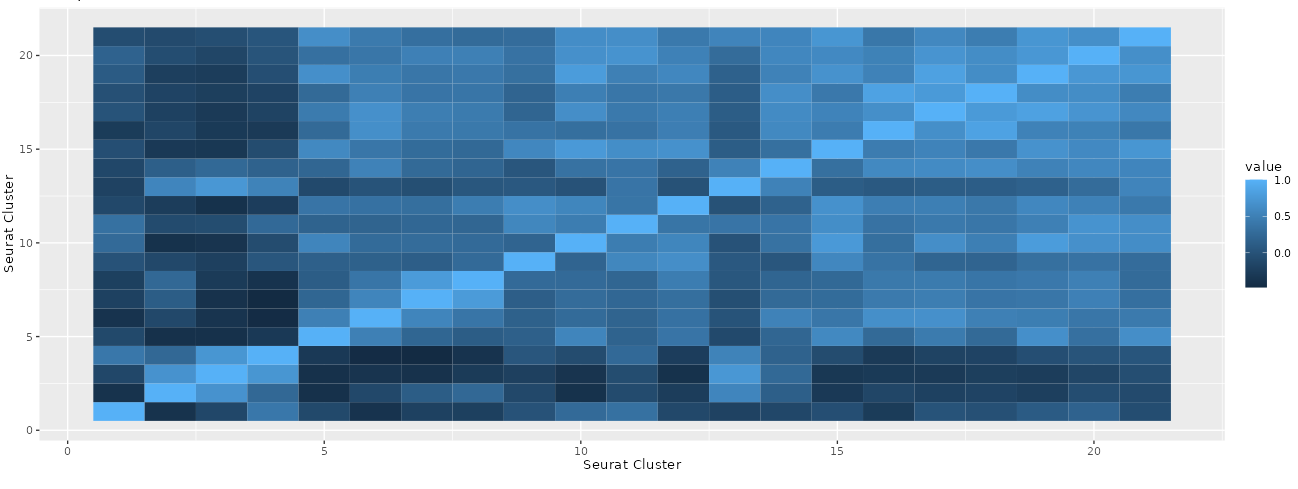
In the second tab of our interactive Shiny App, we displayed a bar chart where each bar represents a specific cluster and its height indicates the number of cells within that cluster. The second plot used the Pearson correlation coefficient to compute the correlation between each pairwise combination of clusters based on the average PCA values of each cluster. This resulted in a square heat map that illustrates the strength of the correlation between two clusters through the intensity of the color in each box. The resulting heatmap is shown below (Figure 2).
2.3 - UMAP Markers
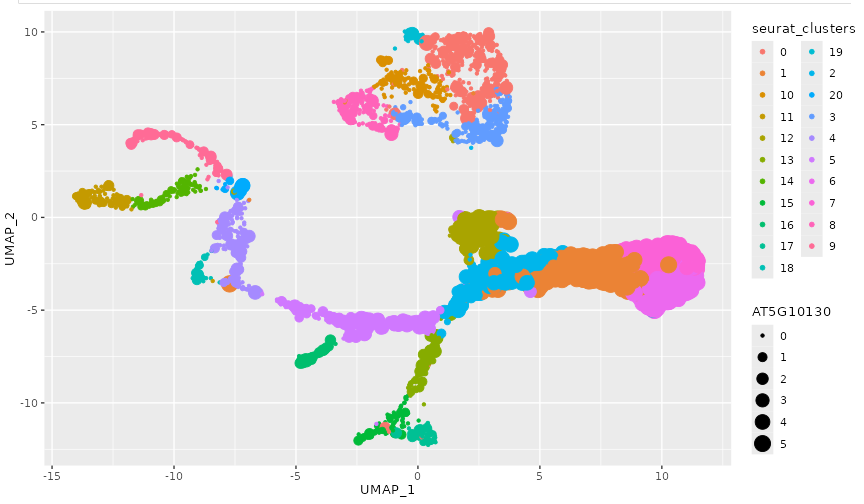
In the third tab, we implemented a slightly different structure than had been previously used in our other tabs. We split the third tab into two subtabs to differentiate between the different marker types. We used the UMAP coordinates to create a scatter plot in the first column and a dropdown menu in the second column, implemented with the selectInput method. We applied the same color scheme used in the first tab, with points colored by clusters to maintain consistency and avoid confusing the client. The dropdown menu includes either the putative or anticipated gene markers (depending on which subtab the user is currently in). These markers were provided by the client. Once a marker is selected, the data points are scaled proportionally to the gene expression level of the chosen marker (displayed in Figure 3). Additionally, each cluster is a different color (like in the first tab), to make differentiation between the clusters more simple. This design allows the client to easily identify clusters with higher expression levels similar to the gene of interest. An example of one marker chosen is shown below.
3 - Development Narrative
We developed the first tab, containing both UMAP and PCA plots, first. This was helpful because it was the easiest to execute, and helped the team create a plan for the rest of the app development. Additionally, the UMAP plot was also needed in the third tab, so it was helpful to have it already finished. This part of the process went smoothly with no errors. The most difficult part was overlaying the clusters onto the UMAP, but that issue was resolved by being able to transpose one onto the other. This was the first bit of teamwork that was needed and set the pace and expectations for the rest of the project. The result allowed the user to select certain clusters of interest to analyze similarities and differences between each.
Our second tab features a bar chart and a square heat map. The bar chart allows the client to examine each cluster and see the number of cells within each. Creating the heat map involved several computational methods and packages. We used the ggplot, reshape2, and dplyr packages to calculate and average the PCA values by cluster, transforming the data and plotting it on a heat map. The initial calculations and computations were challenging, causing this tab to take longer to complete than the first due to the complexities involved in creating these visualizations.
In our third tab, we created a UMAP plot to display the gene expression levels of the gene markers. This tab took the most time to complete as it required a different approach than initially planned. One of the challenges concerned the best way to display the different markers. Given the large number of markers provided by the client, categorized as ‘anticipated markers’ and ‘putative markers,’ it was decided that we would create two subtabs within the third tab. Each subtab contains a dropdown menu with the markers (either anticipated or putative) This allows users to switch between marker categories easily, making it simpler to distinguish between them and display changes accordingly. We also encountered an issue with the structure of the putative and anticipated marker files provided by the client. Each of the files were formatted differently, which made it difficult to use both for the same purpose (i.e. using the same code). To resolve this, we manipulated the anticipated marker file to match the structure of the putative marker file. This enabled us to display the graphs according to the marker, cell barcode, and cluster size to compute the expression value.
We believe that the end result fully meets the client’s requests and specifications in regards to the details of the structure and execution. This application enables the client to visualize the single-cell RNA-seq dataset of Arabidopsis Thaliana root effectively. We believe that the comparative analysis between clusters offers valuable insights into the relevance and significance of cluster distinctions, providing visual interpretations that can guide decision-making. Furthermore, by maintaining consistency throughout our application, we have ensured that the client’s requirements, specifications, and research needs are met. The cohesive design and functionality of the application create visualizations that not only enhance engagement but also increase satisfaction in their research. Through this comprehensive tool, the client can explore their dataset more deeply, gaining meaningful insights and making informed decisions based on the visualized data.
4 - Conclusion
In conclusion, we recognize that single-cell RNA-seq datasets can be quite large and complex, necessitating efficient methods to draw meaningful conclusions. Our client tasked us with utilizing their single-cell RNA-seq data on cells from Arabidopsis Thaliana root to create a Shiny application for performing both numerical and visual analyses. The client provided pre-clustered data, but they sought our expertise to identify similarities and differences between these clusters. They required tools for quick comparison of cell clusters using principal component analysis (PCA) and UMAP visualizations, enabling the clear observation of cluster similarities and differences.
The client also aimed to understand the biological significance of the data through visualizations of putative and anticipated biomarkers. They wanted to identify which genes acted as cell type markers, irrespective of their statistical significance or threshold for differentiating clusters. We created visualizations displaying the expression values based on the provided tables of putative and anticipated biomarkers, helping them determine if the predicted biomarker genes overlapped with previously known markers.
While we believe our application meets the client’s requirements, there are several enhancements that could further improve the user experience and the client’s understanding of the dataset. One improvement would be to standardize the point size scale across all gene expression values. Currently, the scaling is based on each selected gene’s minimum and maximum expression values, but it would be more appropriate to scale based on the expression values of all genes in the dataset. This change would produce new plots that are more easily comparable.
Another enhancement would be to include the gene names alongside their IDs in the dropdown menu in the third tab of our Shiny application. This addition would help the client better understand the dataset and the specific functions of each gene. With this information, they could more easily categorize and identify genes with higher expression levels in specific clusters. Currently, the client might need to look up each gene ID in a database to identify its function. By incorporating gene names, users would be able to make more informed hypotheses about gene function and regulatory networks, leading to a deeper understanding of the biological meaning of the data.
These improvements would enhance the overall functionality and user experience of the Shiny application, enabling the client to gain more insights and make more informed decisions based on their single-cell RNA-seq dataset.